The Problem
The activity tracker on the Healthyroads website allows users to connect their devices like Fitbit and Apple watch to track and view their activity on the Healthyroads Website. Users can get rewarded once they complete the required activity. After initial research, we found out that the activity tracker was being under-utilized. Users were not checking the Healthyroads trackers as often as we thought.
The Solution
How might we help users become more interested and engaged in using the Activity Tracker and provide more meaningful information around setting goals and help them stay more active?
We didn't want to compete against other apps like Fitbit and Apple Health, which already did a great job of displaying activity data. Instead of competing with other apps, we focused on providing more meaningful information around the user's goals and help them set and track their goals. We wanted to provide more meaningful information regarding their data and their overall progress. We wanted to help them understand how many steps, calories, or minutes they should be doing daily and understand what the ideal goal is.
 Project Role
 Team Structure
 Tools
Tools
Primary and Secondary Research
Primary
For primary research, we interviewed current Healthyroads users and conducted open-ended interviews, a UX survey and tested prototypes with the intent to find out how users felt about the website, what the issues were, what their health goals were, and how they used the activity tracker.
Secondary
For secondary research, we looked at existing industry research on activity tracker usage and popularity.
Card Sorting
Conducted a card sorting study to find out the best menu navigation groupings and categories.
Usability Testing
User-tested the existing website to find any issues or opportunities for improvement. We asked users to accomplish specific tasks to find out the usability of the activity tracker.
Prototype Testing
Conducted continuous prototype testing for new features, new ideas, and changes to ensure we were on the right track.
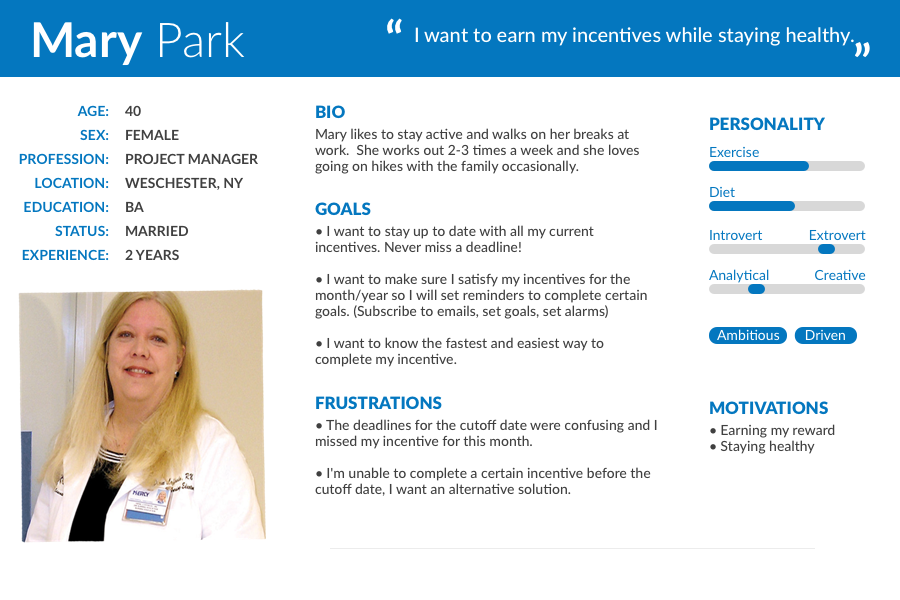
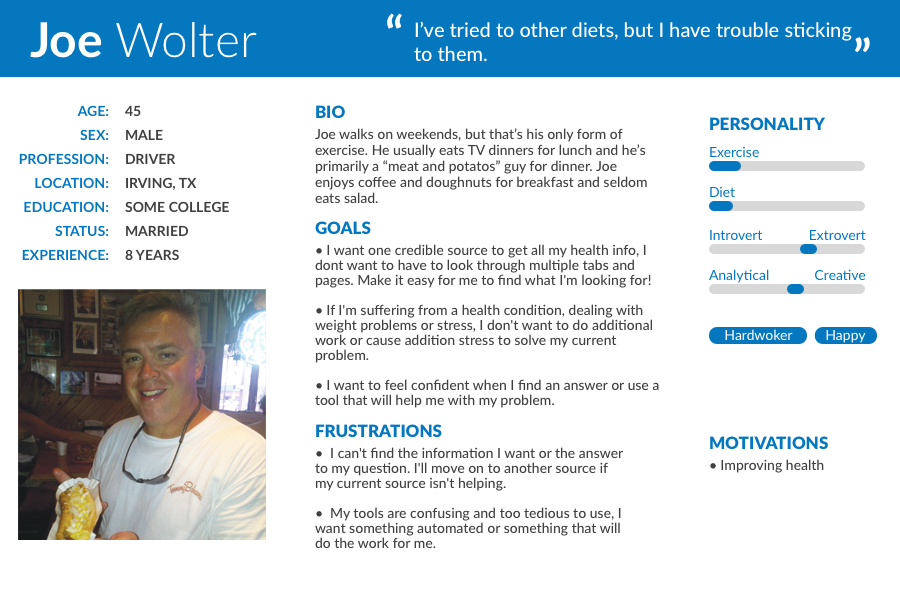
Personas
Personas were based on user interviews and finding the most common type of users, one active and another less active user who needs to be motivated to workout more.
User Pain Points and Opportunities for Improvement
After initial research, user interviews, and usability testing, we found out what were the main user pain points. We came up with three main pain points or opportunities for improvement which eventually were implemented into the design.
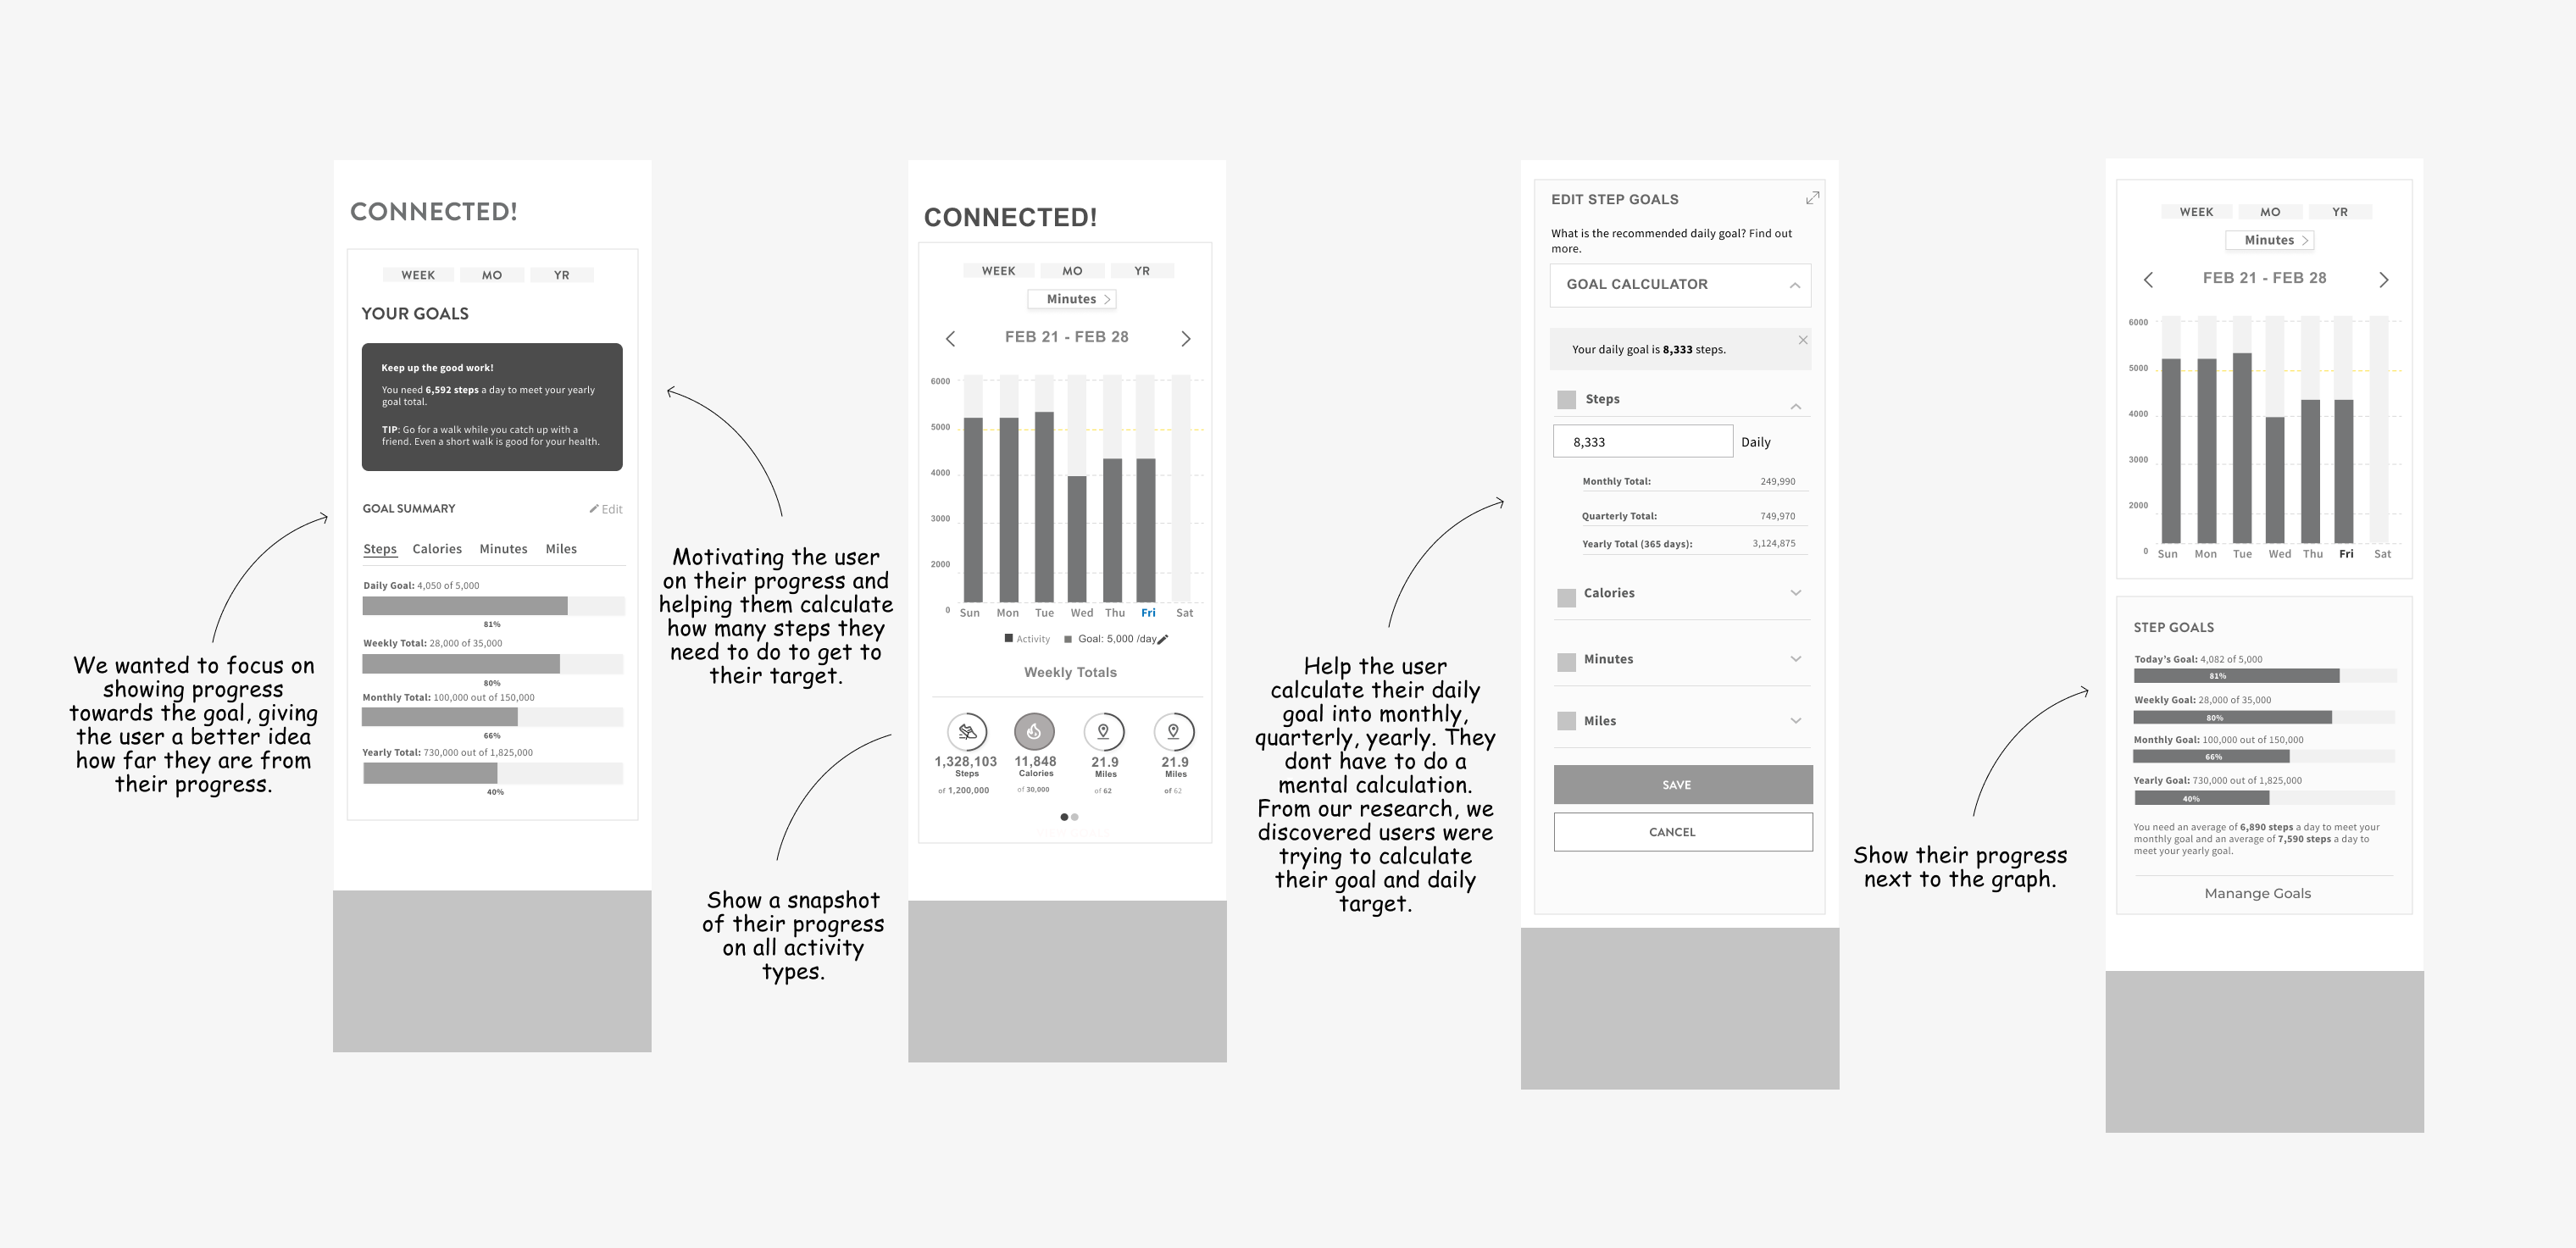
Unclear Progress
- While looking at the graph, users are unsure how far they were towards their target goal.
- Users make calculations in their heads to try to figure out how many steps they need to accomplish their goals.
Unclear Goals
- Users are unsure of how many steps they need to do daily and what the recommended is.
- They want their data more meaningful and knowing how they can achieve their goals.
Multiple Devices
- When users had multiple devices connected the data was adding all the devices together. It was hard to know their true total points.
Storyboarding
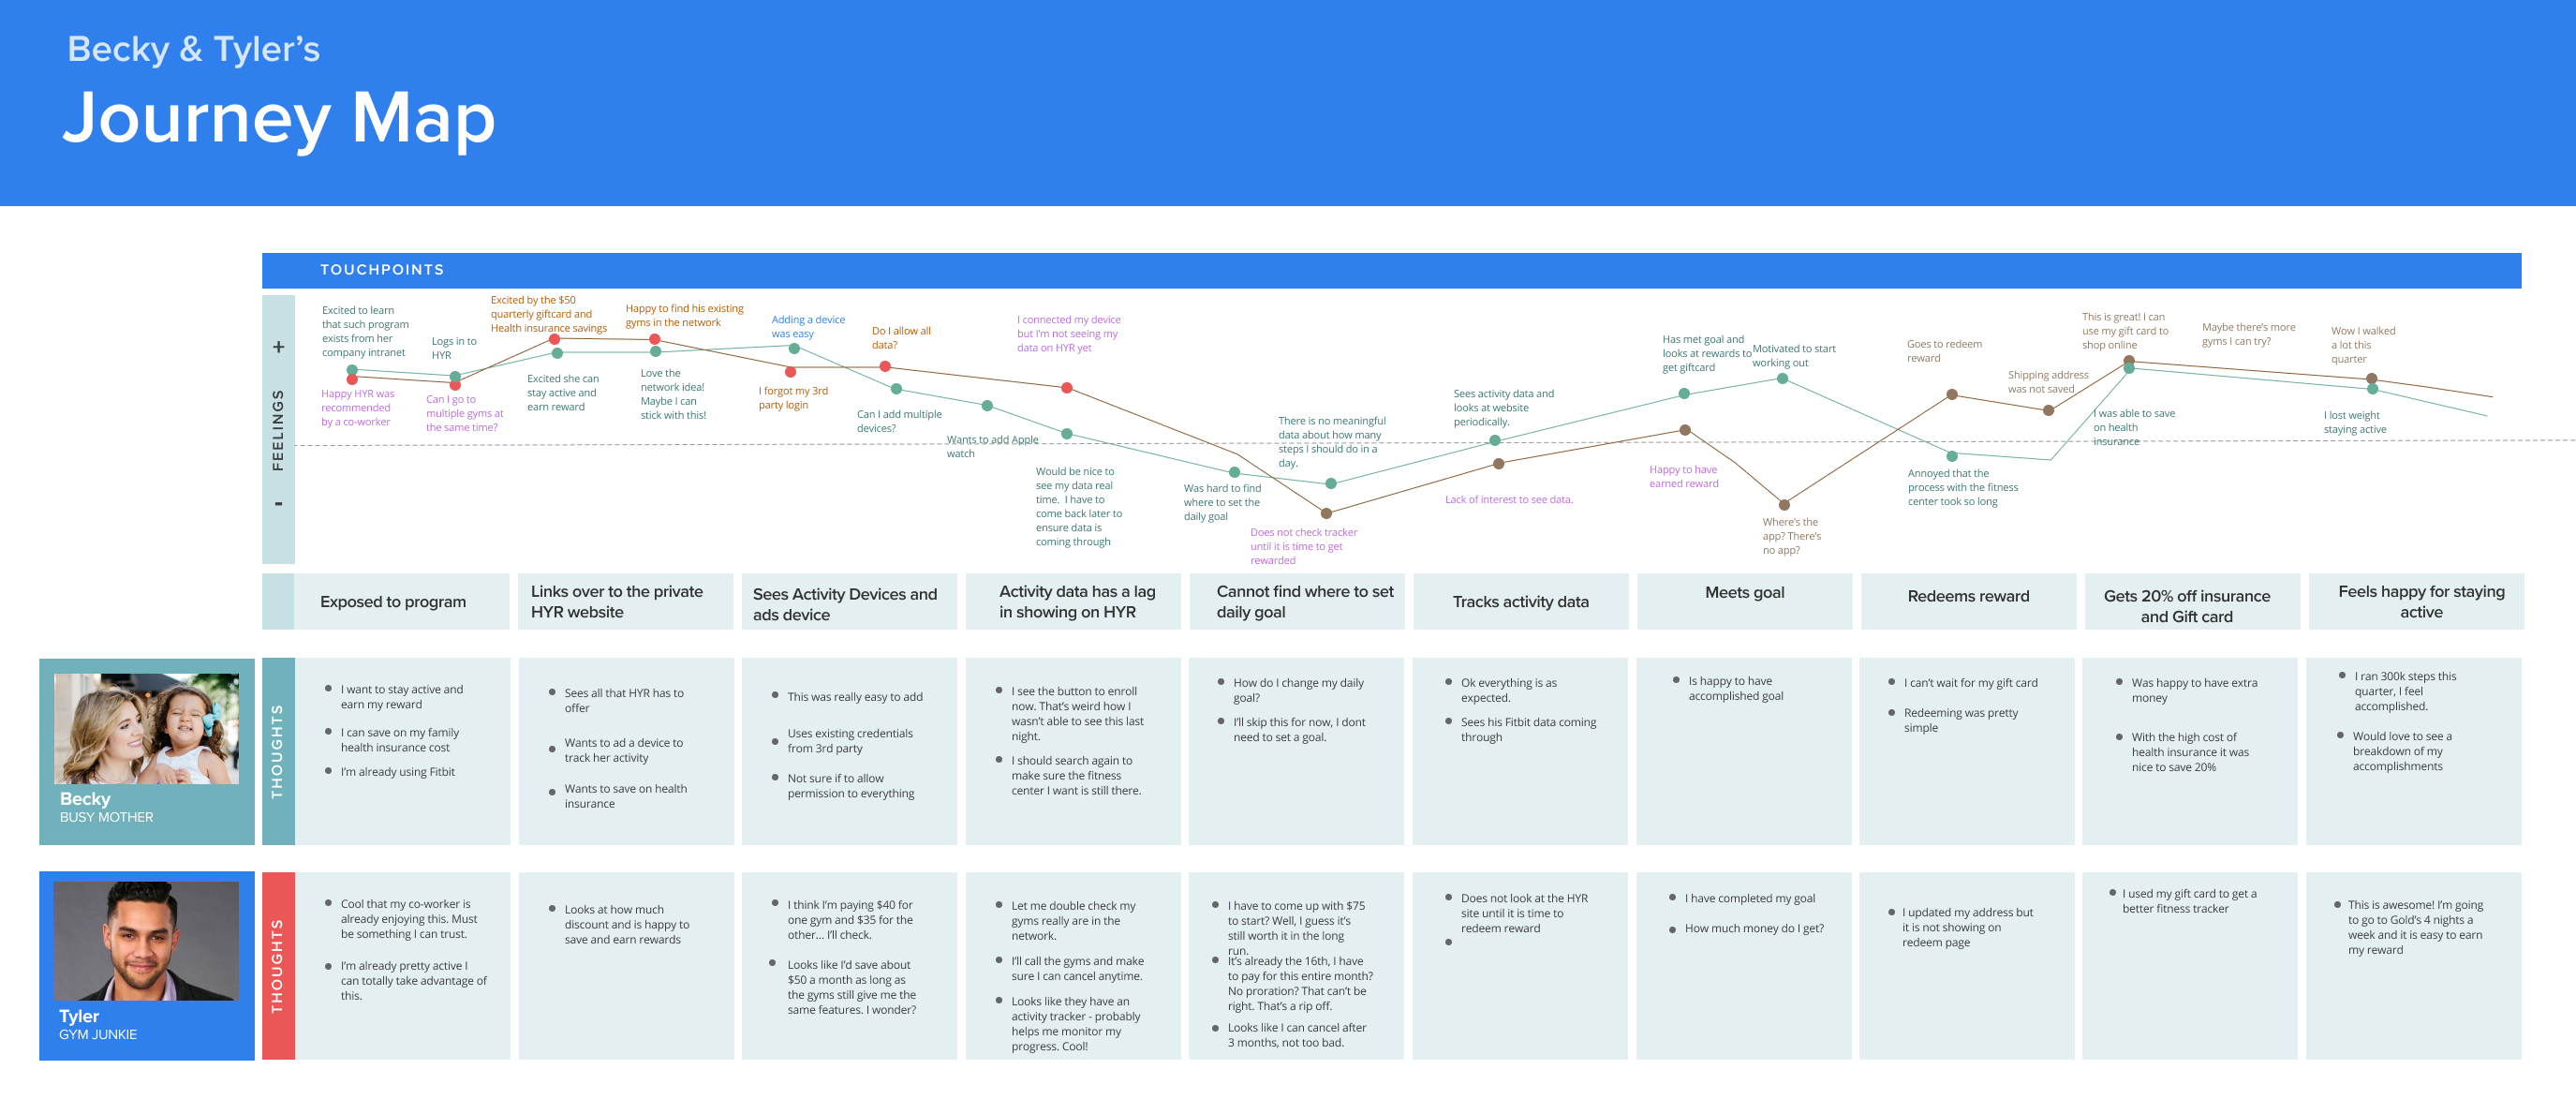
The current user journey has some pain points with setting the goal and little value in activity data.

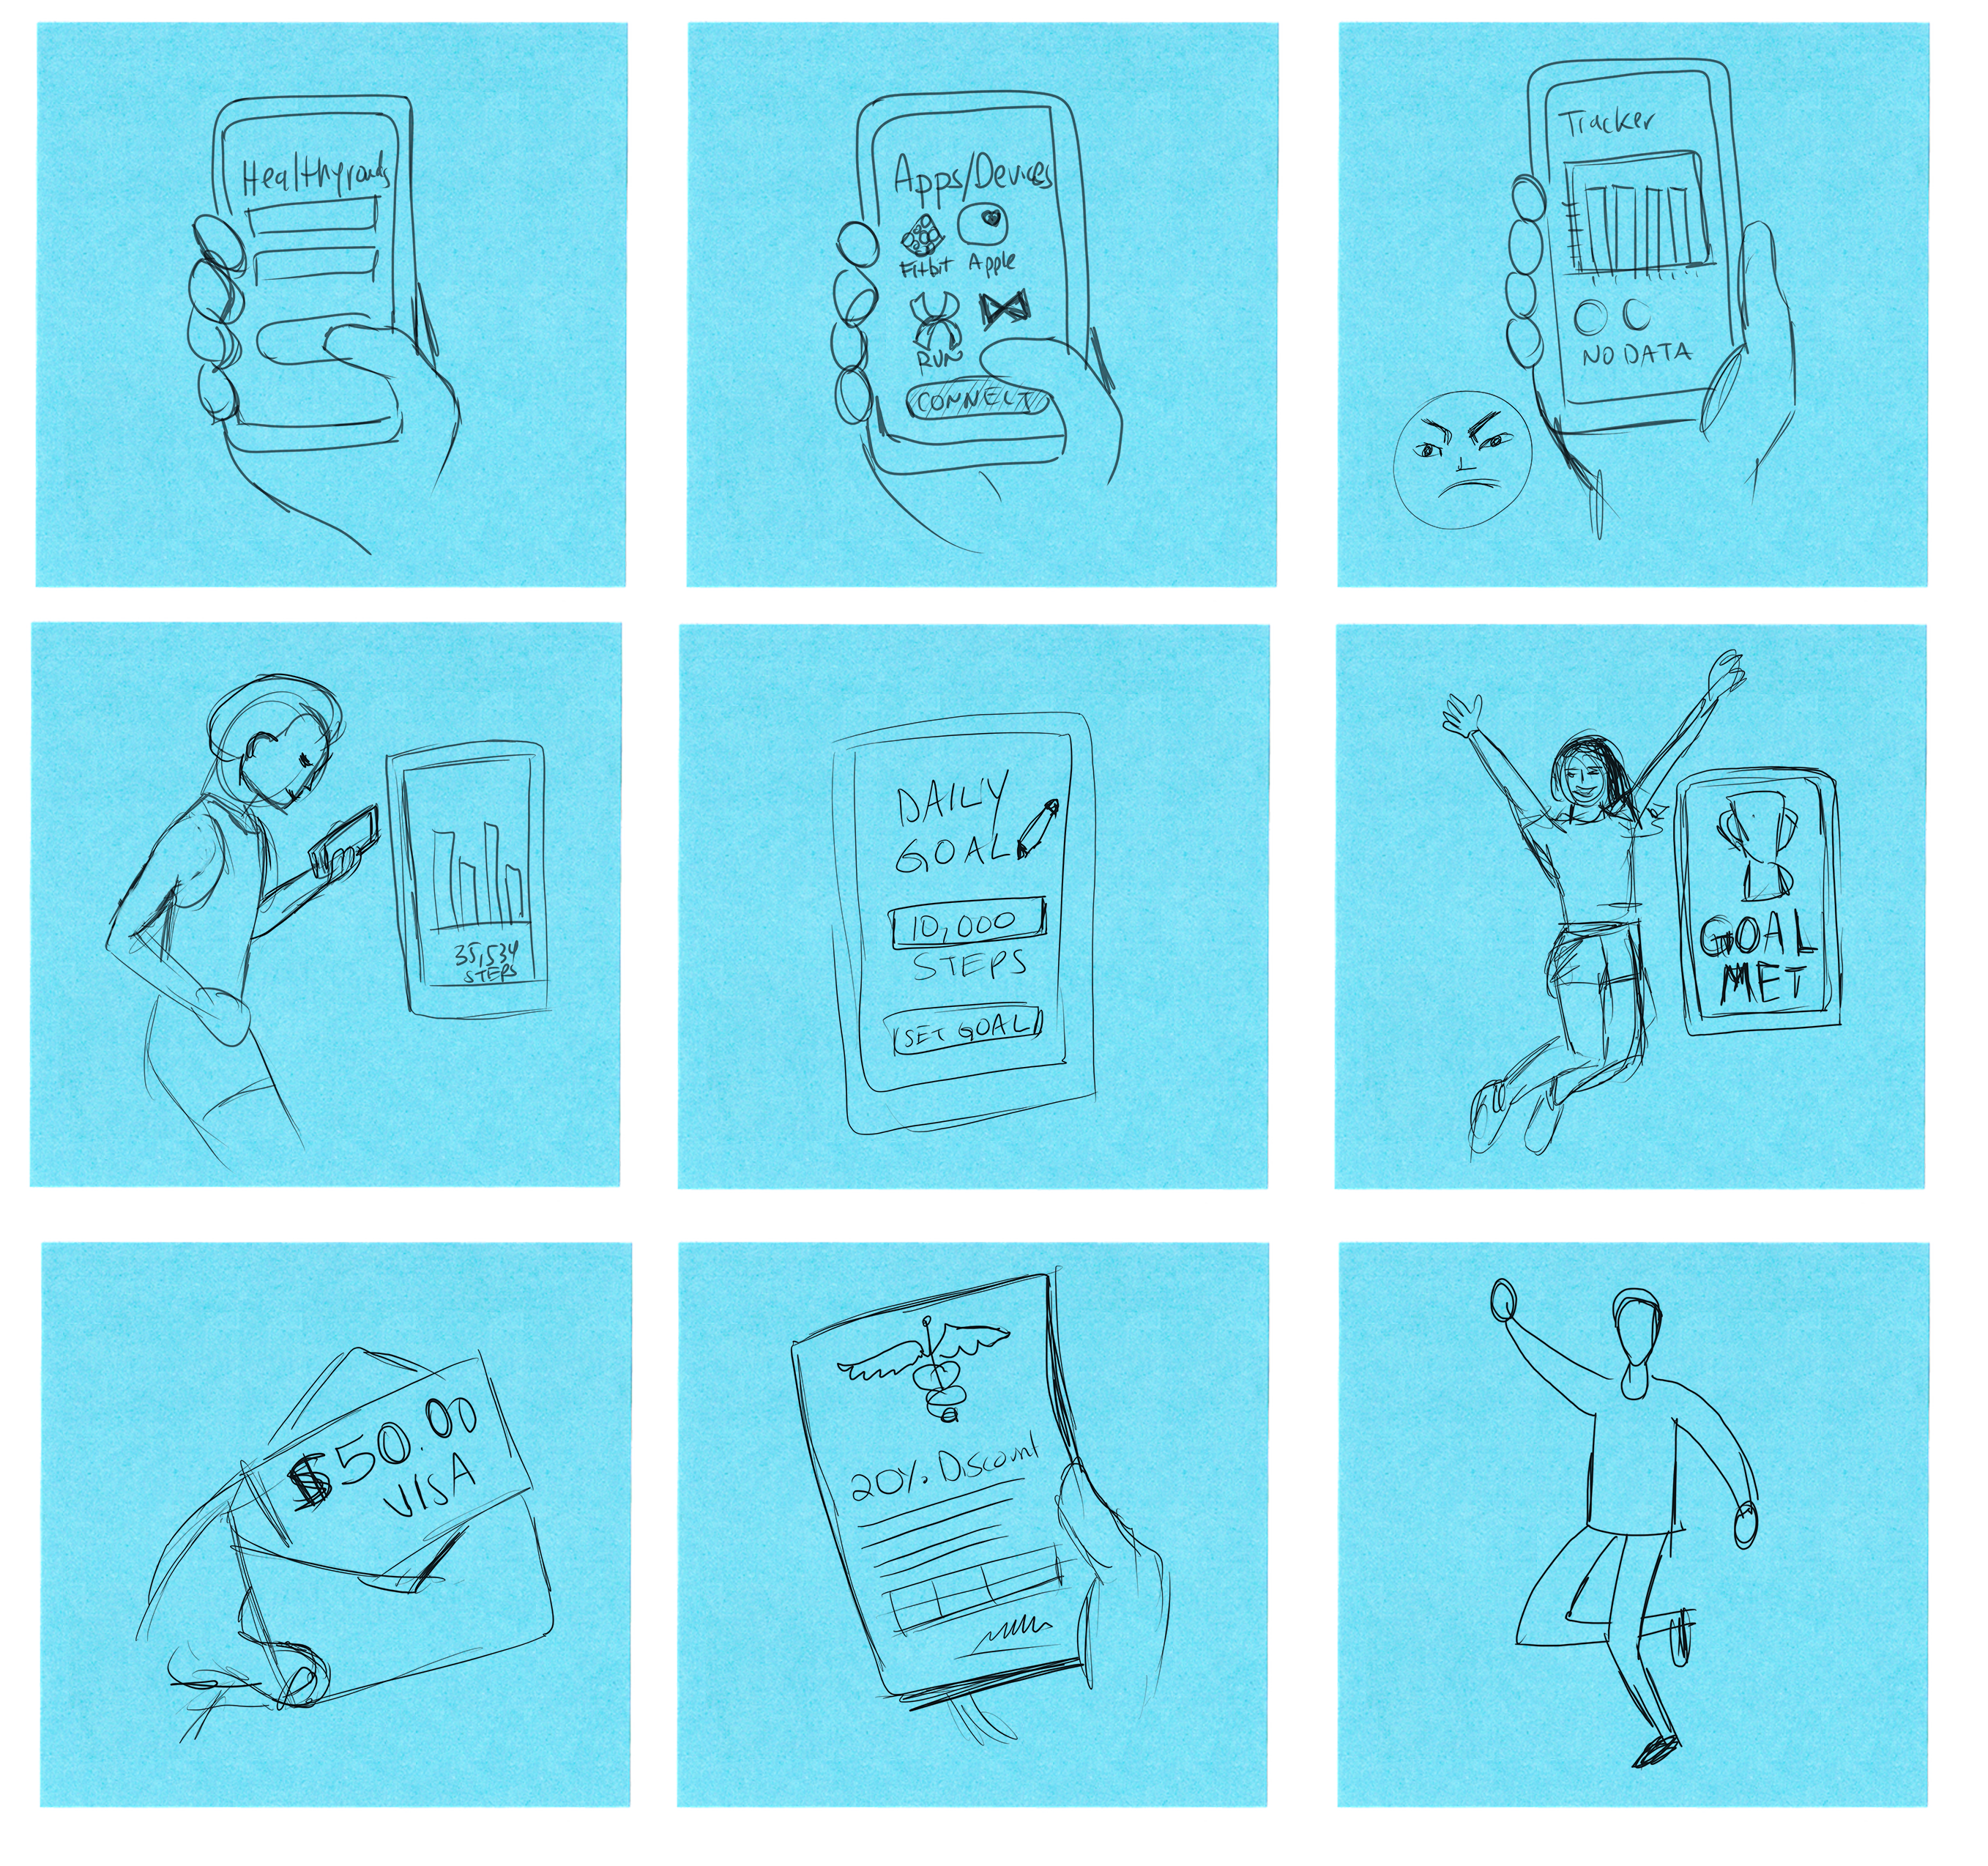
Journey Map
User Flow
Wireframes
In the wireframing phase, our goal was to solve some of the pain points and explore opportunities for improvement.